Several ground-based and airborne field campaigns have been performed in support to the WIVERN concept in the last five years.
Airborne Campaigns
The WIVERN airborne proof-of-concept and subsequent enhancement of the science readiness level of the WIVERN concept were conducted in North America in 2016-2018 and 2022-2023, spanning large geographical areas (Wolde et. al, 2019, Battaglia et al. 2017). A large historical database of W-band Doppler radar data collected in diverse geographical regions, including the tropics, has been also conducted using RASTA radar.
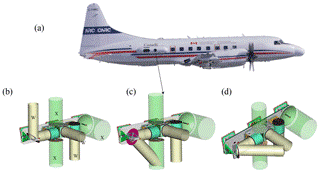
1) In 2016, the National Research Council of Canada Airborne W-band radar (NAW) was upgraded to a Polarization Diversity Pulse Pair (PDPP) mode. After the NAW was upgraded and integrated on the NRC Convair-580 (Figure 1) to operate a PDPP mode, over 30 flights were conducted in the last five years.
Figure 1: The NRC airborne W- and X-band (NAWX) radar installation inside the starboard blister radome mounted on the Convair 580. The aft antenna beam can be redirected from nadir and up to 50° forward along the flight direction. The aft antenna beam redirected (b) to the zenith direction using a reflector, (c) to the nadir-forward and (d) to the side-forward directions.
Data collected during several flights have been used:
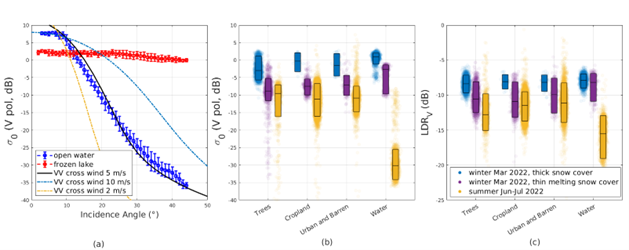
To quantify the surface darkening at WIVERN incidence angles (Fig2, Battaglia et al., 2017);
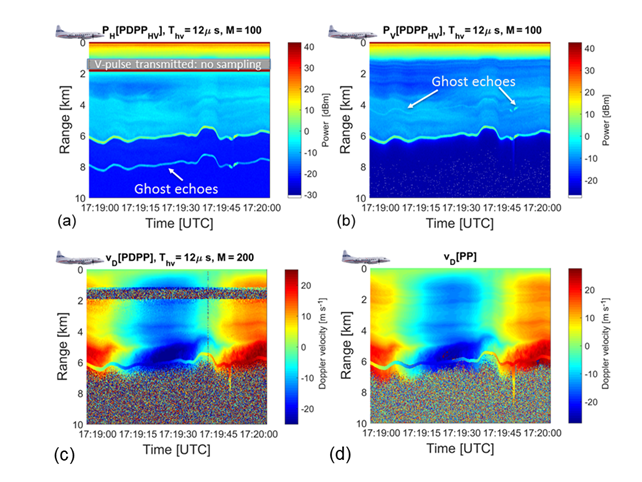
To study the impact of ghosts on Doppler velocity estimates (Fig.3, Wolde et al., 2019);
To confirm that PDPP is an effective technique in measuring very high velocity LoS winds with the expected accuracy (Wolde et al., 2019).
To quantify IWC retrievals from W-band reflectivity using both near-coincident airborne W-band reflectivity and in-situ microphysical measurements (Nguyen et. al., 2023).
Figure 2: Left panel: dependence of σ0 on the incidence angle for open water (blue symbols) and a frozen lake for V-pol radiation. Theoretical curves with different cross winds are show as a reference. Centre panel: box diagrams (with median, 5th and 95th percentiles) representing distributions of σ0 for different land surfaces types around WIVERN viewing angles [between 40° - 43°]. The different colors correspond to different seasons in presence of different snow covers. Right panel: same as centre panel for the linear depolarization ratio, LDRv = Zhv – Zvv.
Figure 3: Example of power as recorded when operating in PolarizationDiversityPulsePair (PDPP) mode with H -pulse followed by a V -pulse after 12 μs. (a) Power received in the H -channel; (b) power received in the V -channel. Ghosts associated with surface cross talk are identified by the arrows. Bottom panels: Velocity as measured by the PDPP technique with tHV = 12 μs (Panel c) and by the consolidate pulse-pair technique with two staggered pulse repetition times of 90 and 120 μs (Panel d). The close resemblance between Panel (c) and (d) is a proof that the PDPP technique performs as expected.
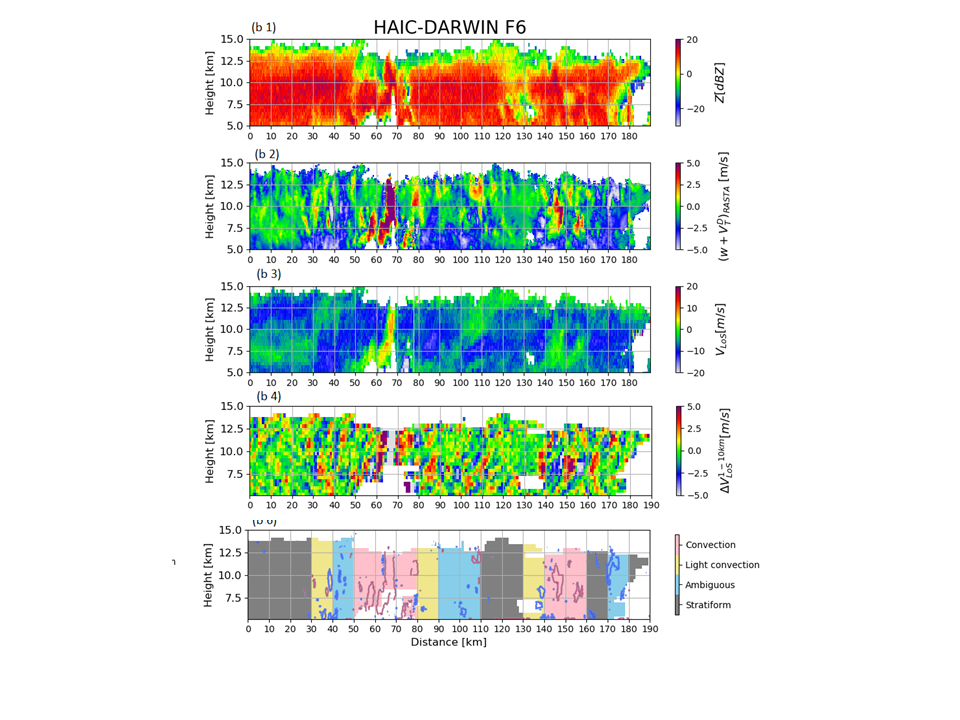
2) The French RASTA airborne W-band radar (https://rali.aeris-data.fr, Delanoë, 2013) retrieves the 3D in-cloud wind by combining independent Doppler velocity measurements from the multi-beam antenna system and measures associated reflectivities at a high resolution (between 100 m and 300 m horizontally and less than 60 m vertically). This enables to simulate the reflectivities and Doppler LoS velocities as observed by WIVERN and thus to study the impact of different effects (e.g. convective motions, hydrometeor terminal velocities) in the reconstruction of the horizontal line-of-sight winds (see example in Figure 4).
Figure 4: A stratiform region with embedded convection observed bu the RASTA radar during the HAIC-DARWIN campaign. From the top, first row: W-band reflectivity; second row: RASTA vertical Doppler velocity. Third row: simulated WIVERN LoS velocity at 1 km resolution. Fourth row: stratiform/convective classification; red and blue contours correspond to updraughts and downdraughts.
Ground-based campaigns
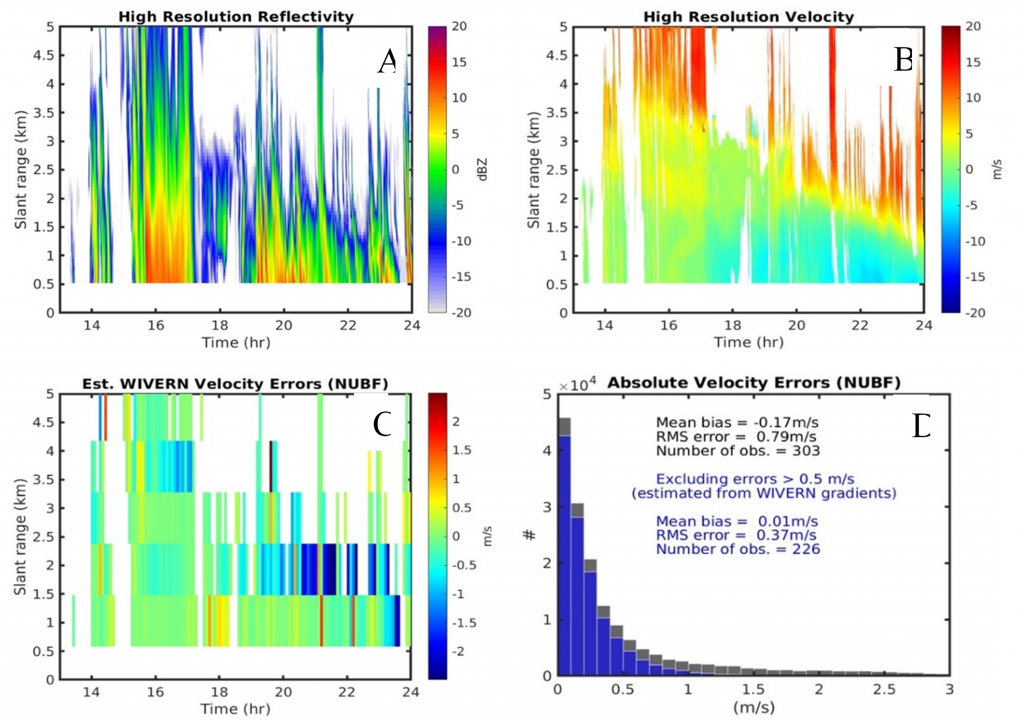
The Galileo W-band radar at the Chilbolton observatory has also been upgraded to polarization diversity capabilities. Observations have been useful to characterize climatological values of LDR, to understand potential errors associated with strong wind shear conditions (Fig.5) and to confirm that the theoretical treatment of the effect of ghost in increasing the RMS error of the Doppler is correct (Illingworth et al., 2018).
Figure 5: Radar observations of a case with very high wind shear (20 Aug 2017). Height-time plots of (A) reflectivity and (B) velocity at high resolution (60 m x 7.2 sec.) from ground-based radar. (C) Observed NUBF velocity biases at the WIVERN scale (5 min. x 800 m. (D) Histogram of absolute velocity errors (black) and reduced errors after correction (blue).